Introduction
The goal of this competition is to detect and classify seizures and other types of harmful brain activity. You will develop a model trained on electroencephalography (EEG) signals recorded from critically ill hospital patients.
Understanding Input Data
In dataset provided in the competition are listed below:
- train_eegs(directory): Contain lots of .parquet files.
- test_eegs(directory): Contain 1 .parquet file.
- train_spectrograms(directory): Contain lots of .parquet files.
- test_spectrograms(directory): Contain 1 .parquet file.
- train.csv(file): Metadata for the training data.
- sample_submission.csv(file):
- test.csv(file): Metadata for the test data.
- example_figures:
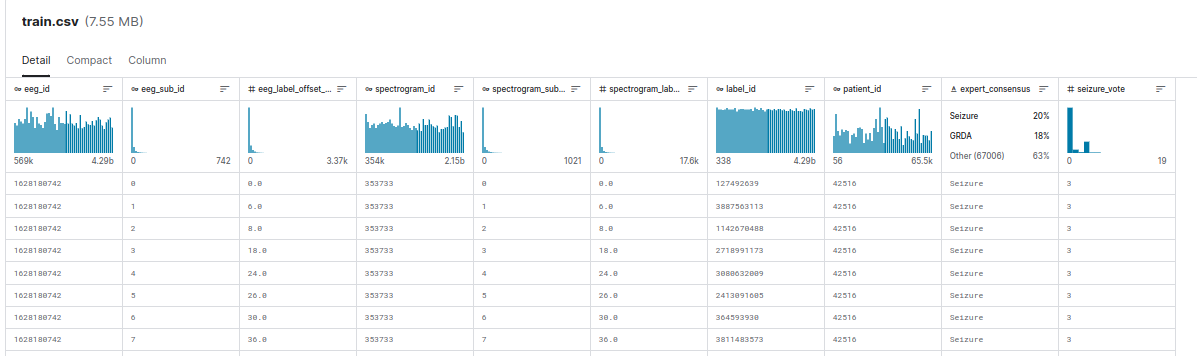
About Train CSV file
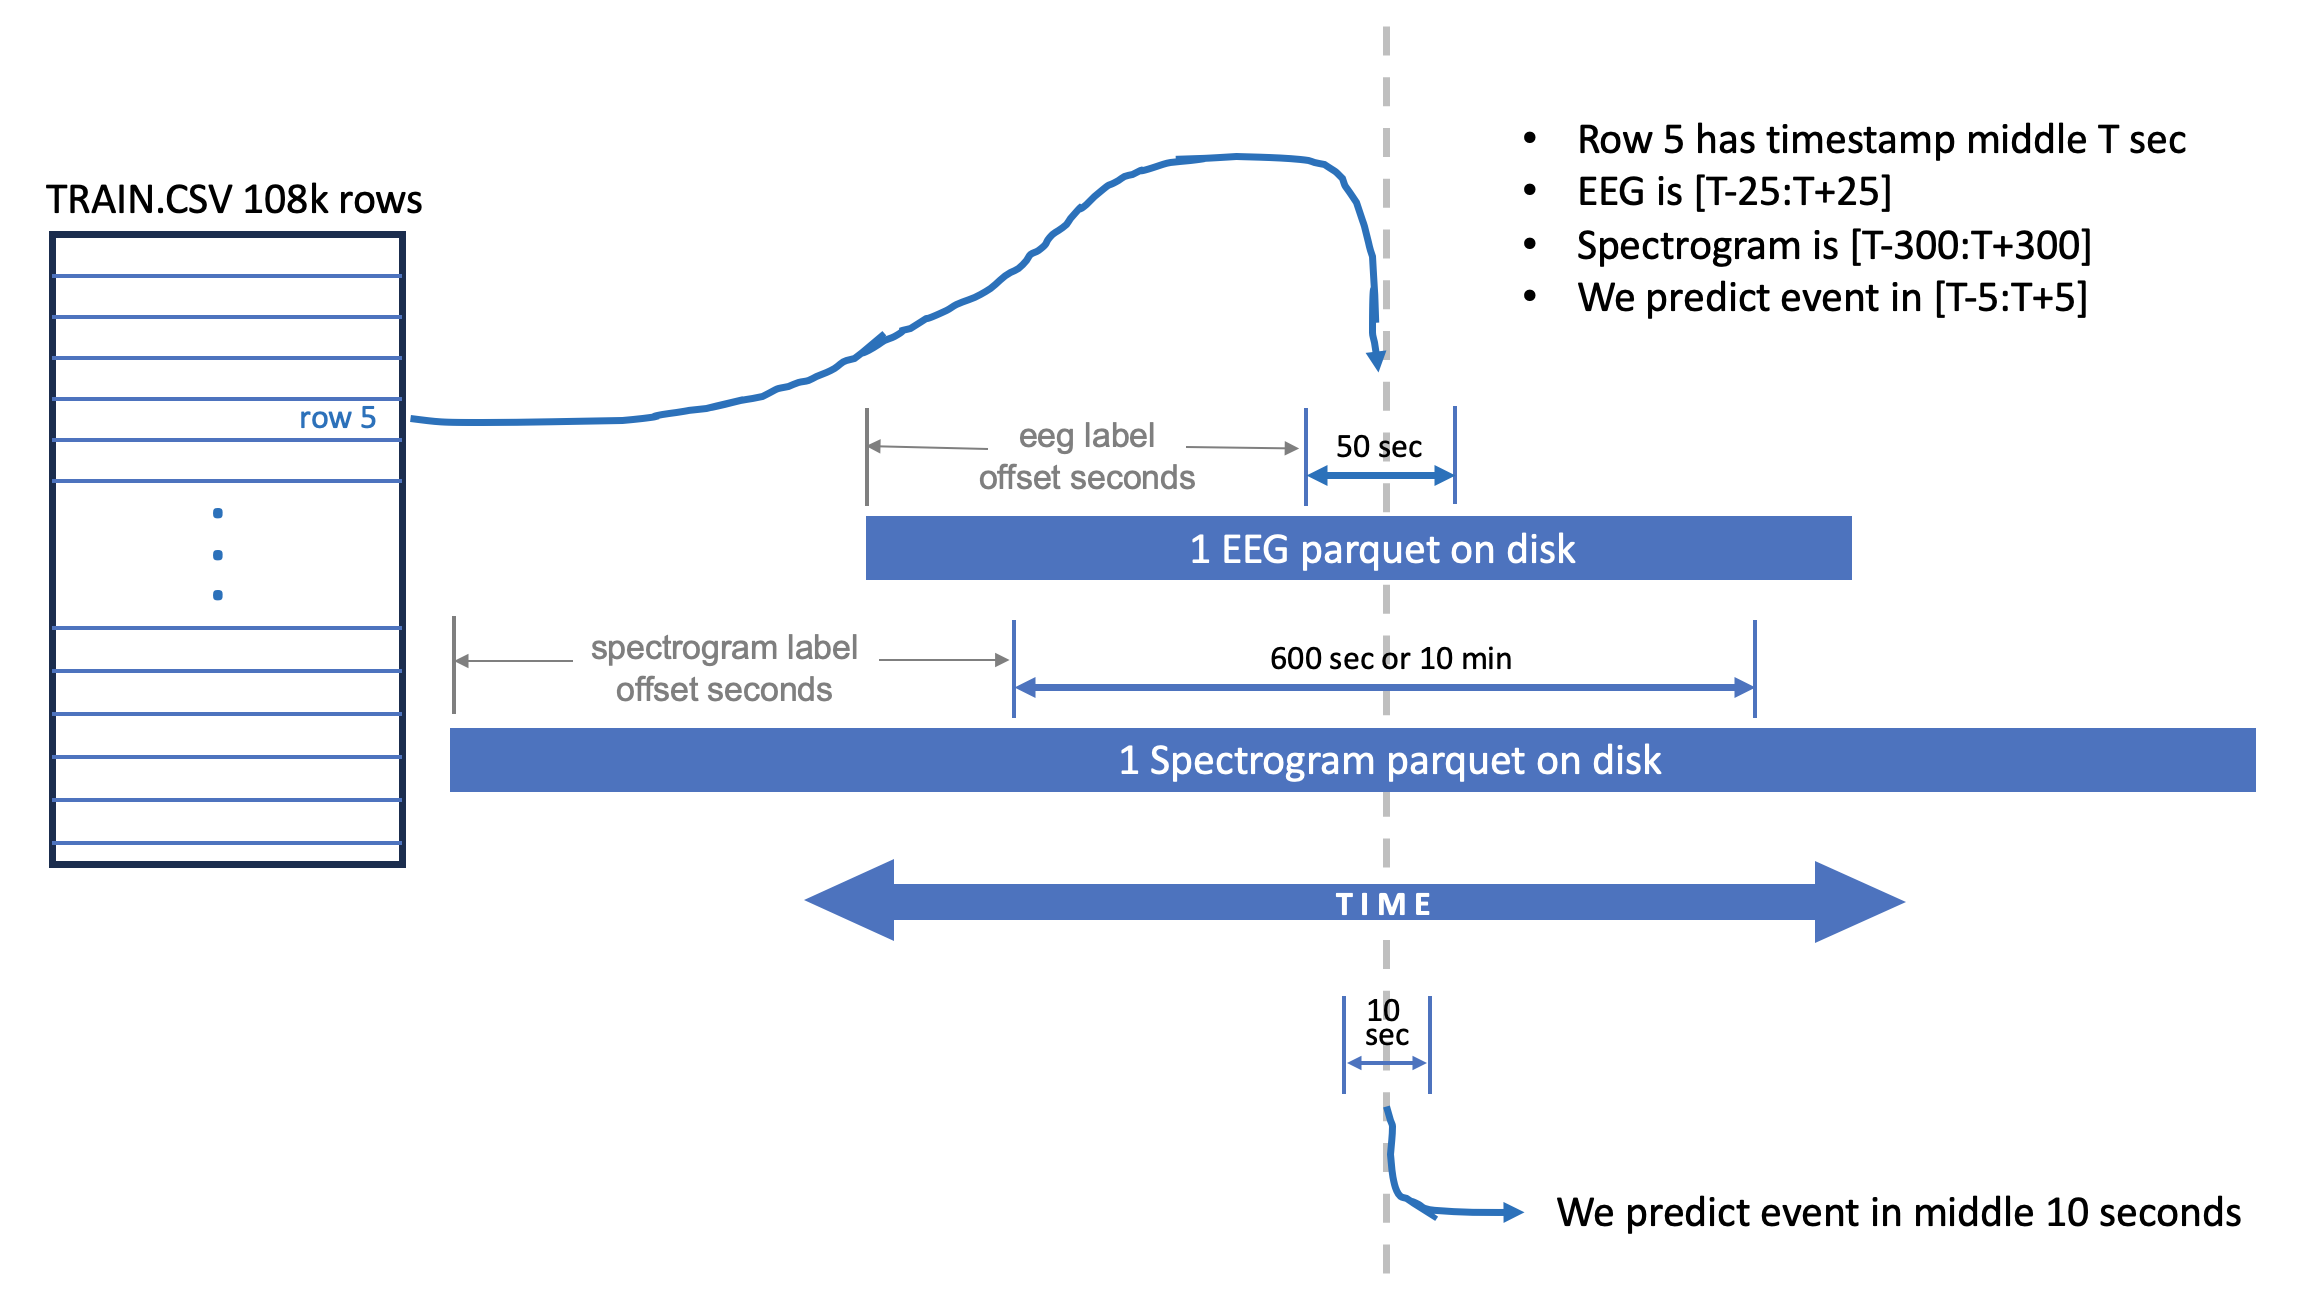
Each row of train.csv is a specific window in time (for a specific patient_id), each row has a specific middle timestamp in seconds.
For example row 235 has center timestamp T = May 3 2023 19:30:06 exactly in the middle of both its EEG time window and Spectrogram time window.
The EEG time window is length 50 seconds and the Spectrogram time window is length 600 seconds. And both have the same center timestamp. In this competition, we are asked to predict the event occurring in the middle 10 seconds of both these time windows.
Center is T
EEG time window is from T-25 to T+25
Spectrogram time window is from T-300 to T+300
We predict event in the middle 10 seconds of both these time windows. [T-5 to T+5]
EEG Parquet Files
The EEG parquet files are longer than 50 seconds. One EEG parquet file has multiple rows of time windows inside it. Similarly, the Spectrogram parquet files are longer than 600 seconds. One Spectrogram parquet file has multiple rows of time windows inside it. 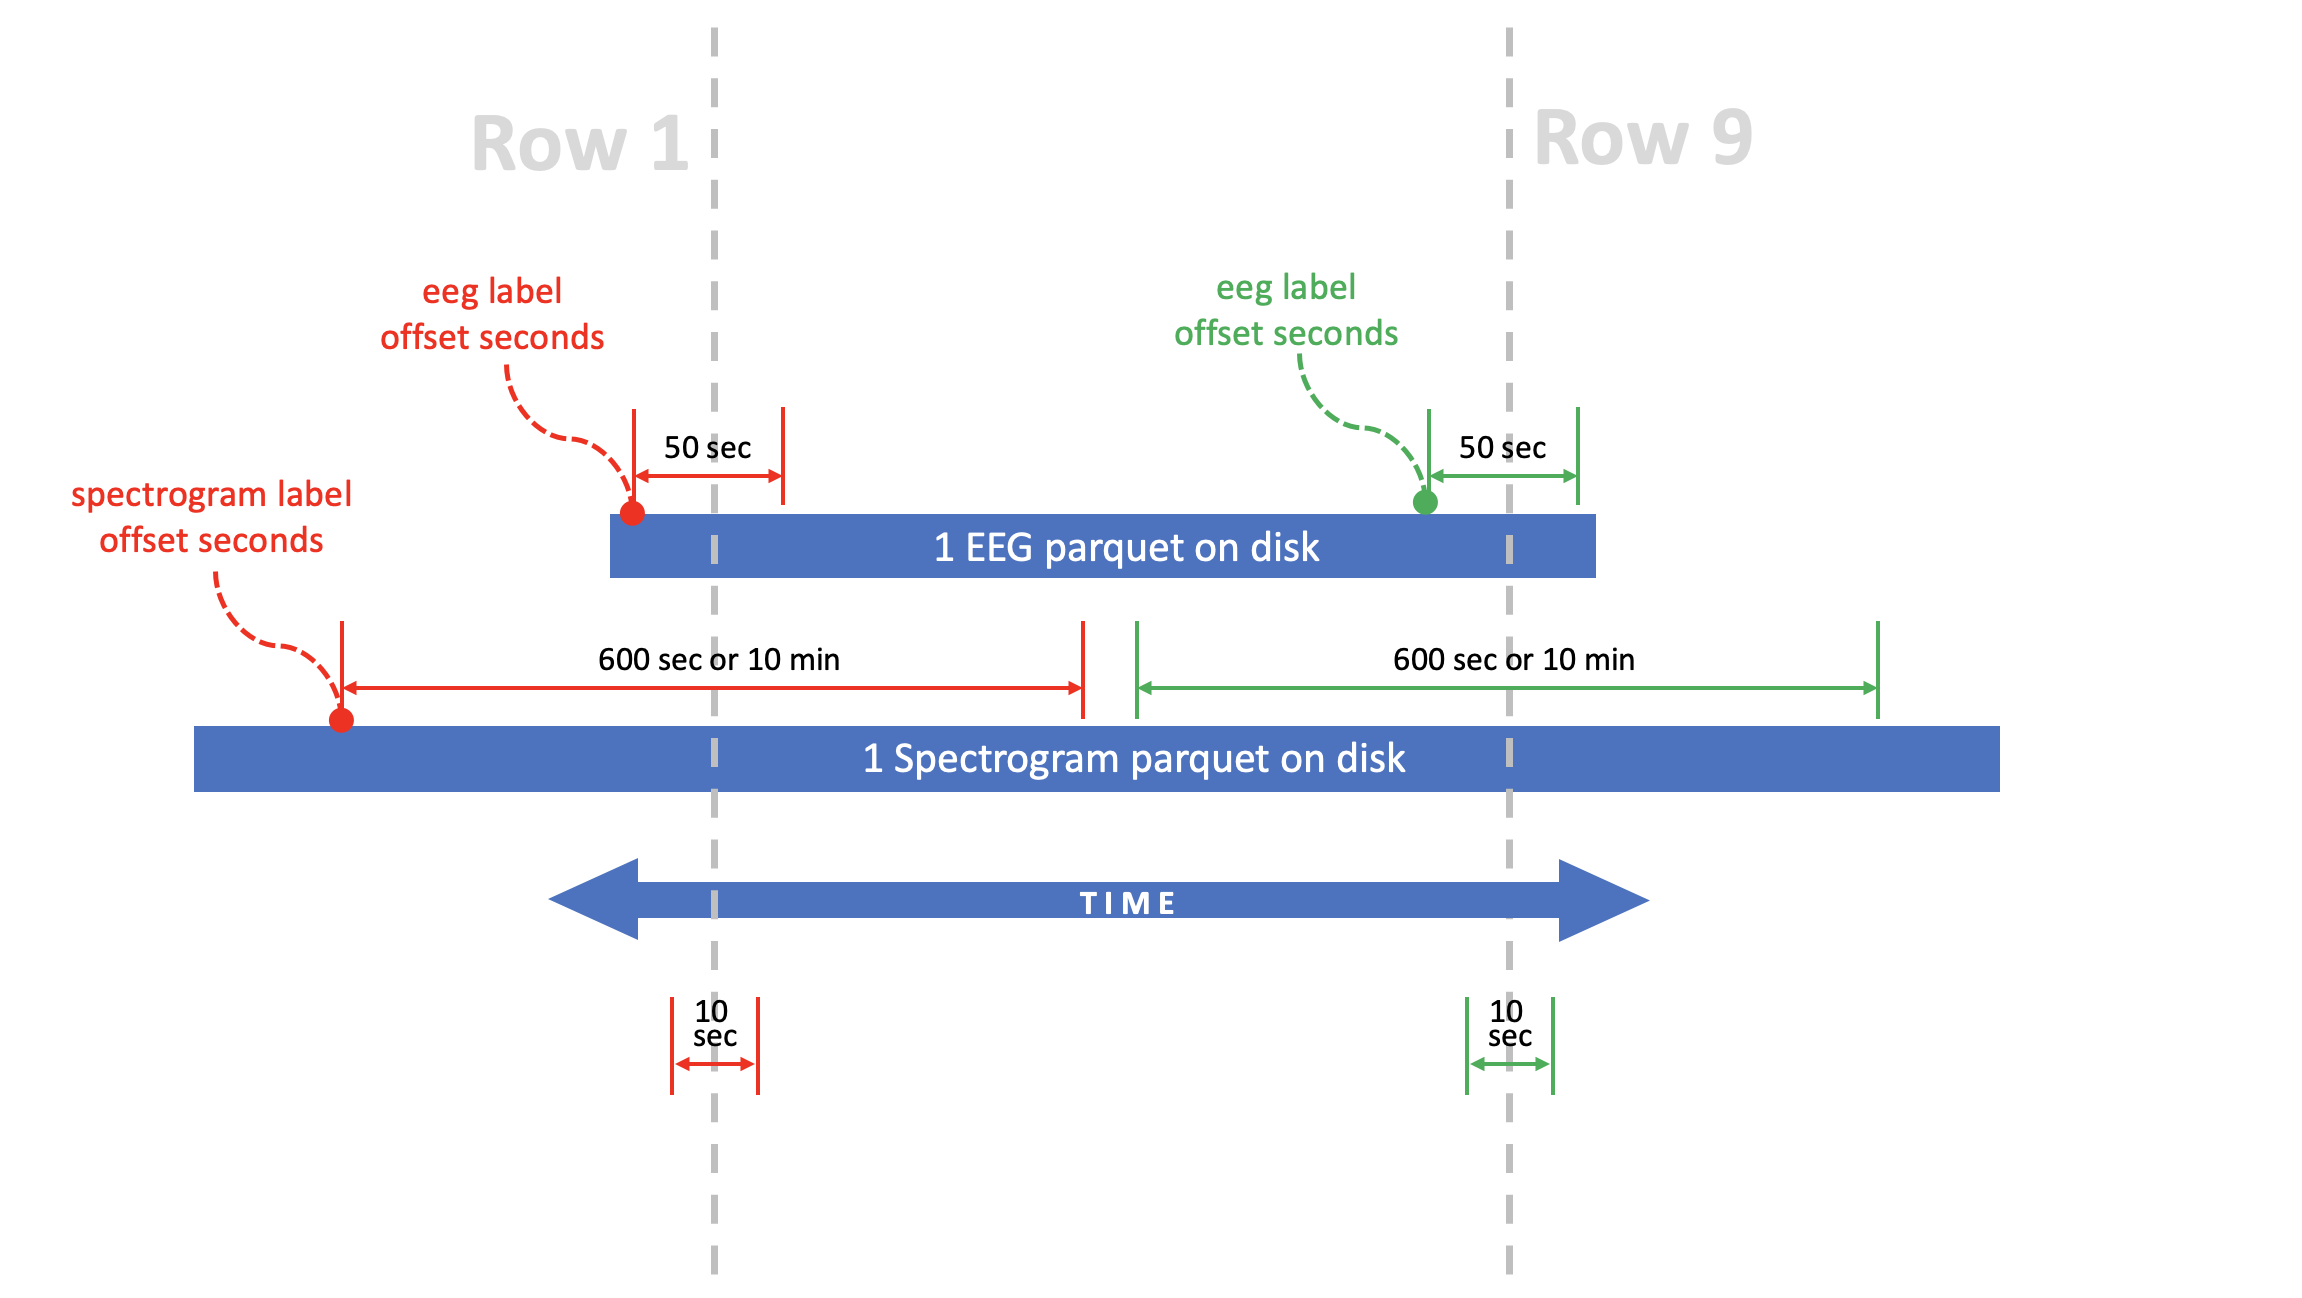
Spectrogram Parquet Files
There are fewer Spectrogram parquet files than EEG parquet files. This is because two rows may have the same Spectrogram parquet file but different EEG parquet files. 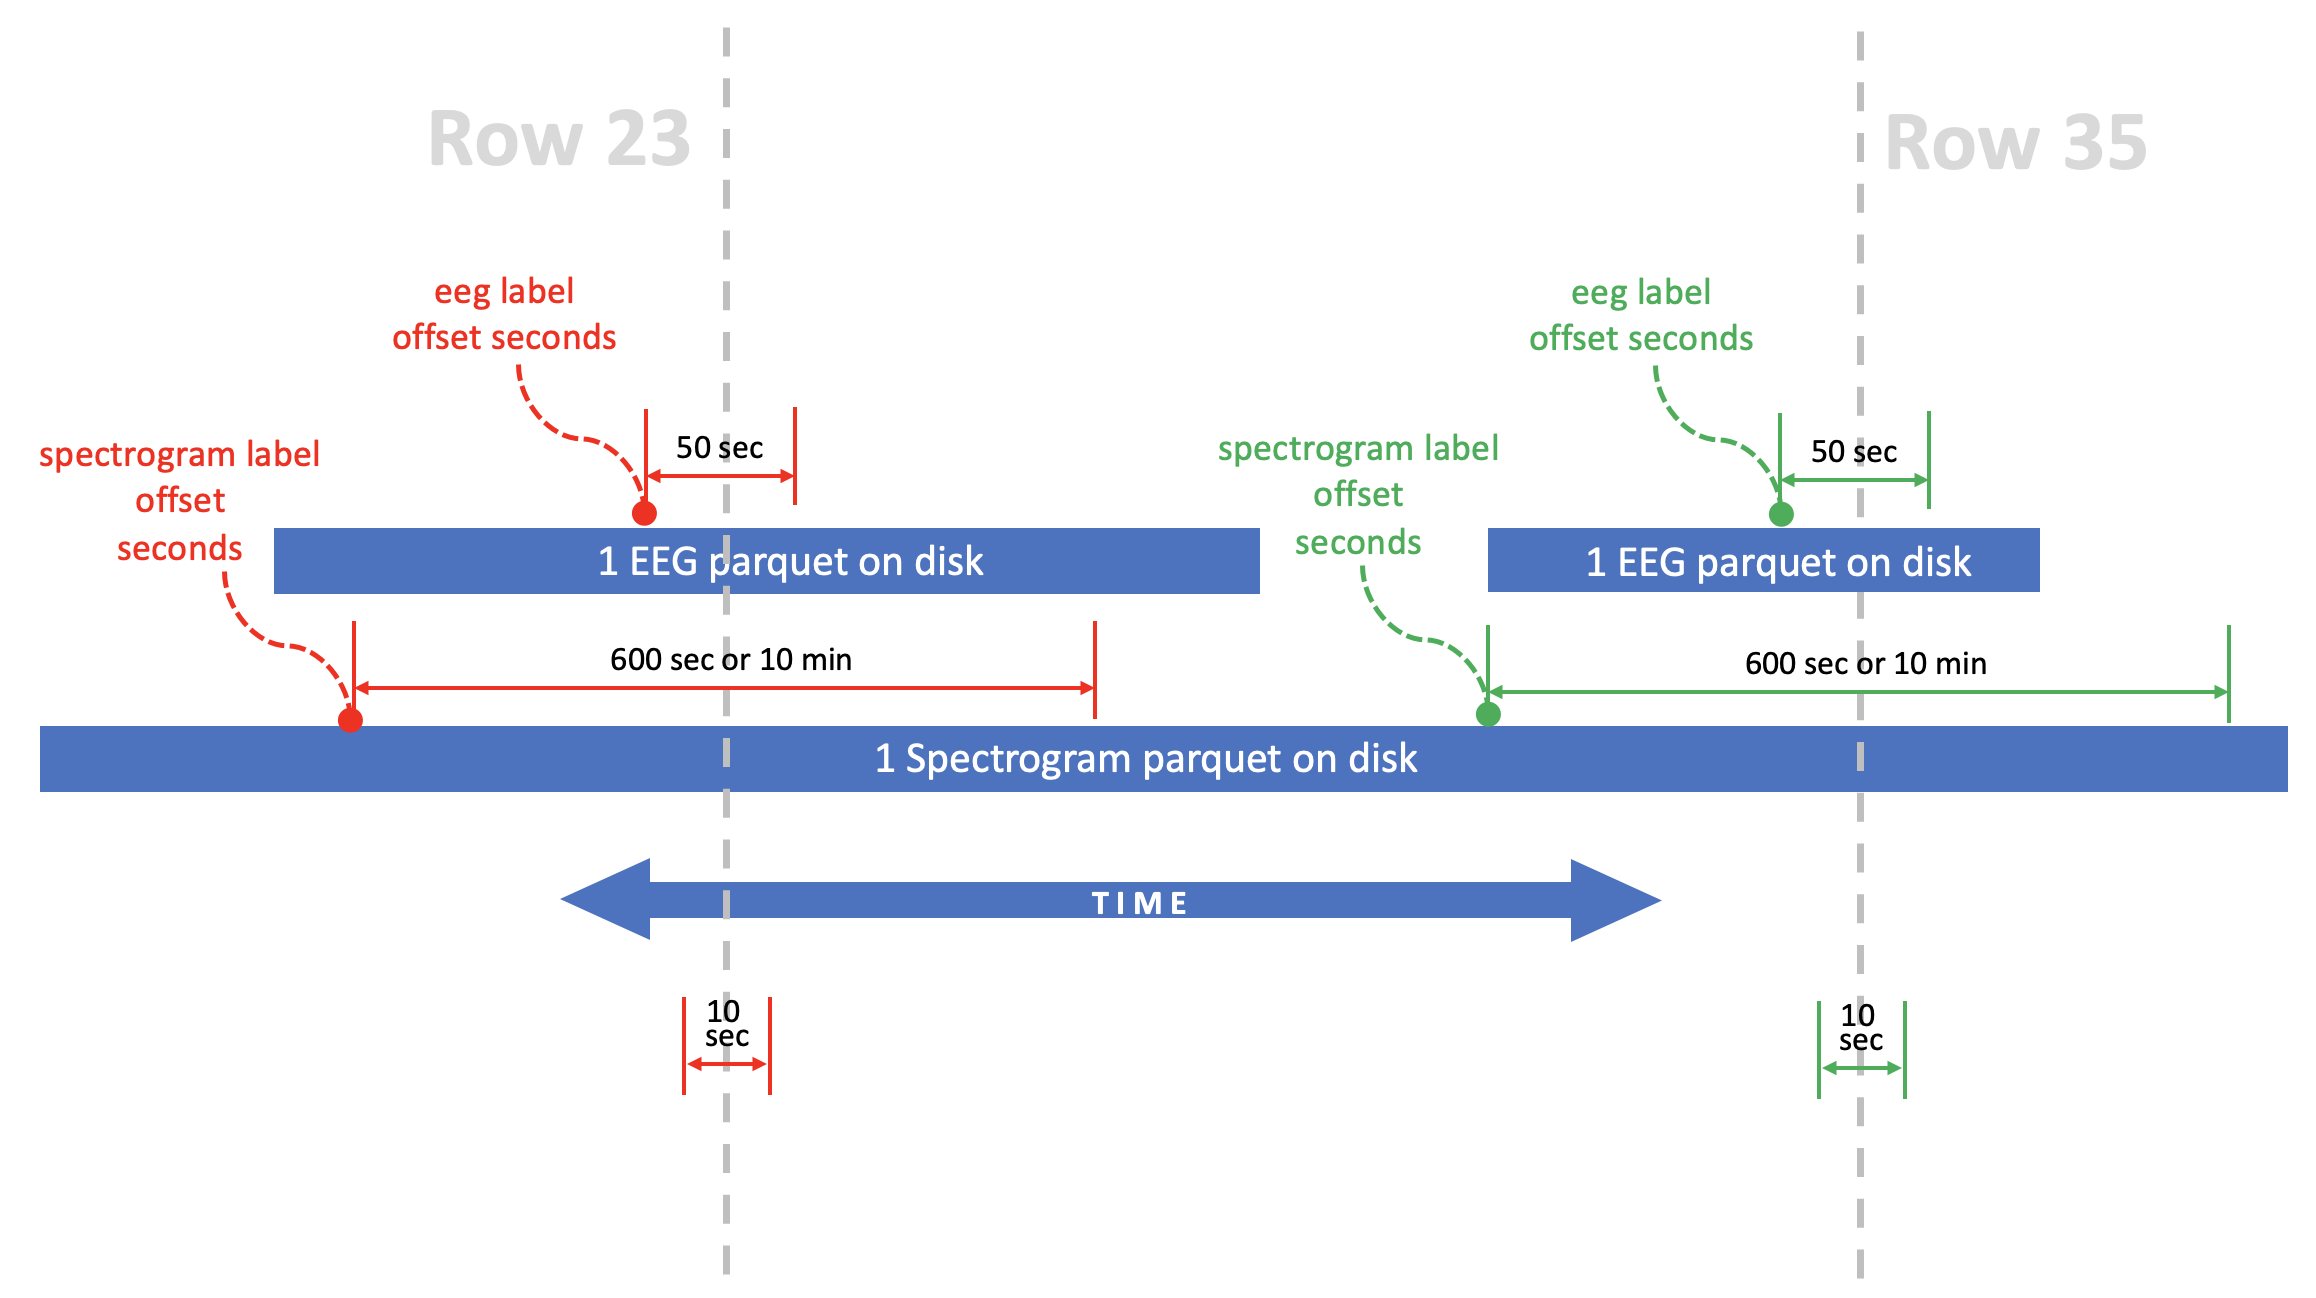
EEG Parquet CSV and Spectrogram Parquet CSV
We have given 20 eeg time series signals for each time window. 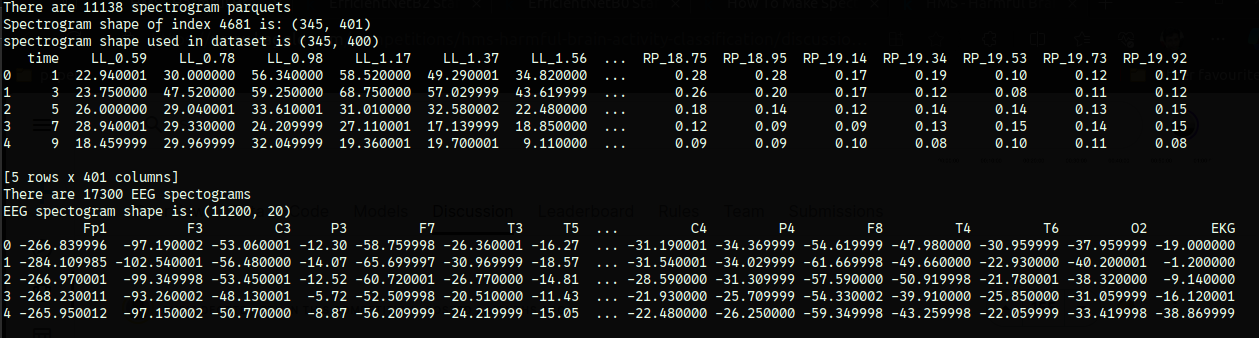
Code to Retrieve EEG and Spectrogram
For a specific row of train.csv, here is the code to retrieve the corresponding EEG and Spectrogram. Note that train.csv doesn’t give us the middle timestamp. Instead, it gives us the beginning timestamp for each time window. The two beginning are determined from eeg_label_offset_seconds and spectrogram_label_offset_seconds. These are offsets from the start of the parquet file which tells us where the EEG and spectrogram time windows begin respectively.
GET_ROW = 0
EEG_PATH = 'train_eegs/'
SPEC_PATH = 'train_spectrograms/'

train = pd.read_csv('train.csv')
row = train.iloc[GET_ROW]

eeg = pd.read_parquet(f'{EEG_PATH}{row.eeg_id}.parquet')
eeg_offset = int( row.eeg_label_offset_seconds )
eeg = eeg.iloc[eeg_offset*200:(eeg_offset+50)*200]

spectrogram = pd.read_parquet(f'{SPEC_PATH}{row.spectrogram_id}.parquet')
spec_offset = int( row.spectrogram_label_offset_seconds )
spectrogram = spectrogram.loc[(spectrogram.time>=spec_offset)
                     &(spectrogram.time<spec_offset+600)]
Keywords and Their Meanings
What is a spectrogram?
A spectrogram is a visual representation of the spectrum of frequencies of a signal as it varies with time. It is a three-dimensional plot where the x-axis represents time, the y-axis represents frequency, and the intensity of the color or brightness represents the magnitude of the frequencies present at each point in time.
What is EEG?
EEG stands for Electroencephalography. It is a technique used to record electrical activity in the brain. EEG measures the electrical potentials generated by neurons within the brain, providing valuable information about brain function and activity.
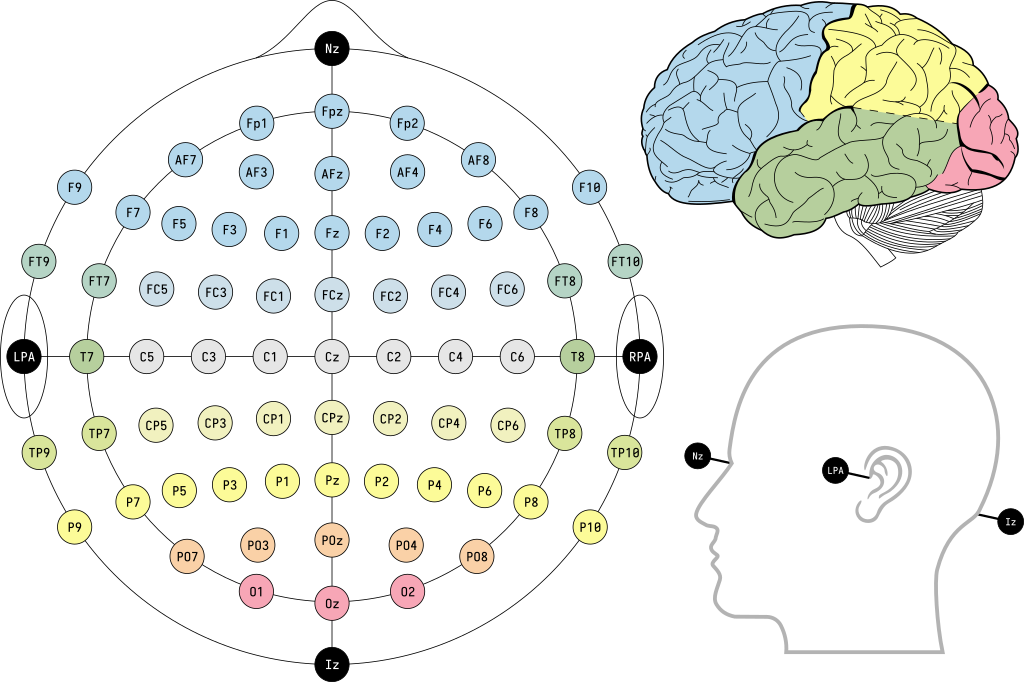
International 10–20 system (EEG)
International adopted method used to measure EEG by placing the electrode over the head at specific positions mentioned in the diagram.
How EEG is recorded
EEG is recorded using a differential amplifier, it provides the difference between the two nearest signals.
How EEG is Displayed
EEG is displayed using Montages. To display it, you find the difference between two adjacent nodes (called channels). Place a few channels together in a single frame called Chain.
Create Spectrogram from EEG
We are using The Bipolar Double Banana Montage method to make a spectrogram from the EEG.
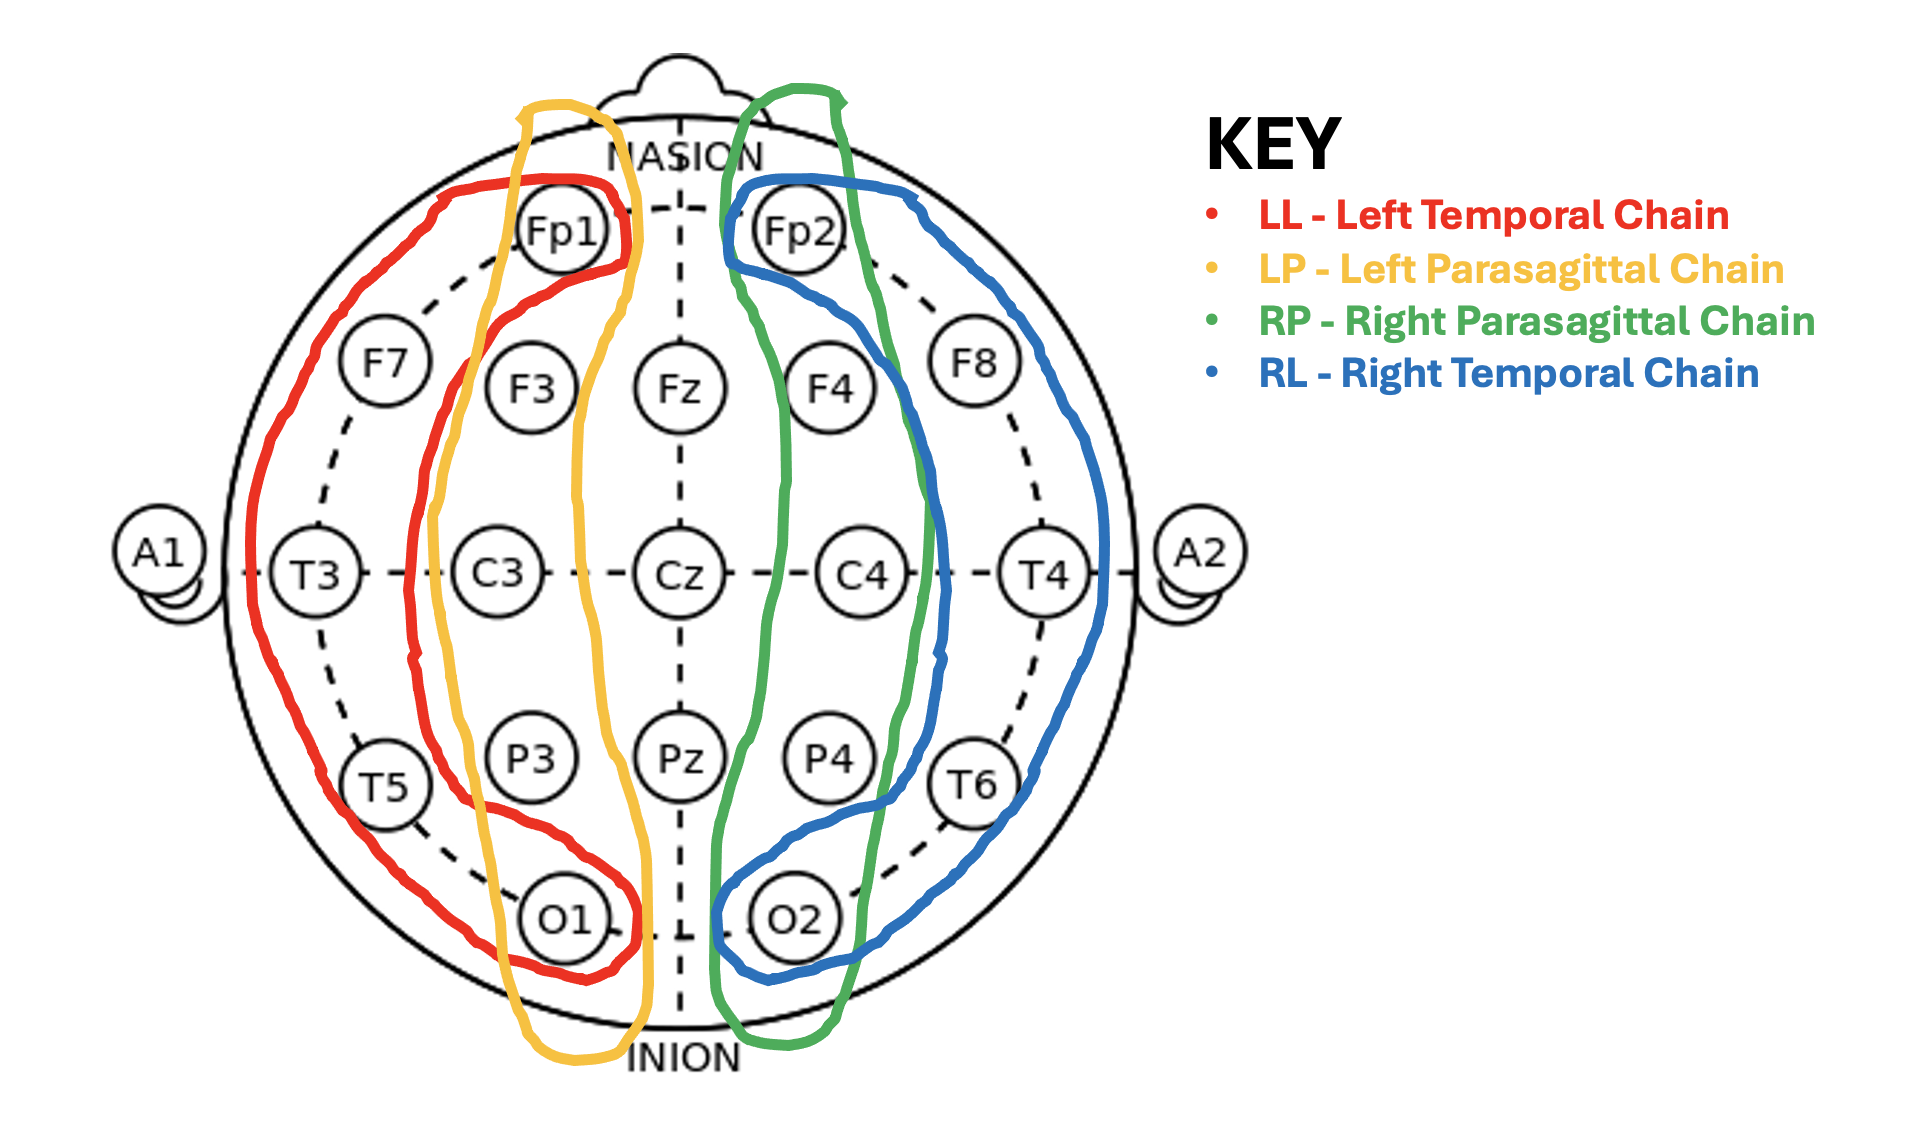
In the diagram, we see which electrode signals are needed to make the LL, LP, RP, RR spectrograms.