# Import necessary libraries
from fastai.vision.all import Path, get_files
import soundfile as sf
import librosa as lb
import librosa.display as lbd
from IPython.display import Audio
from soundfile import SoundFile
import numpy as np
import matplotlib.pyplot as plt
import random
import os
import pandas as pd
from fastbook import *
from IPython.display import Image, display, Audio, Markdown
import plotly.express as pxThe AIM of this post is to understand and analyze the provided data in the competitions.
So far, you must have heard about BirdCLEF 2024 competition. If not, you can check out below references to know about the Competition.

Note: If you want to run the notebook and experiment here is the link: BirdCLIF EDA
# Set config
class Config:
sampling_rate = 32000
duration = 5
fmin = 0
fmax = None
audios_path = Path("../data/train_audio")
out_dir_train = Path("specs/train")
out_dir_valid = Path("specs/valid")Some utility functions
# Get info of the audio file
def get_audio_info(filepath):
"""Get some properties from an audio file"""
with SoundFile(filepath) as f:
sr = f.samplerate
frames = f.frames
duration = float(frames)/sr
return {"frames": frames, "sr": sr, "duration": duration}# Compute the spectogram of the audio file
def compute_melspec(y, sr, n_mels, fmin, fmax):
"""
Computes a mel-spectrogram and puts it at decibel scale
Arguments:
y {np array} -- signal
params {AudioParams} -- Parameters to use for the spectrogram. Expected to have the attributes sr, n_mels, f_min, f_max
Returns:
np array -- Mel-spectrogram
"""
melspec = lb.feature.melspectrogram(
y=y, sr=sr, n_mels=n_mels, fmin=fmin, fmax=fmax,
)
melspec = lb.power_to_db(melspec).astype(np.float32)
return melspecdef mono_to_color(X, eps=1e-6, mean=None, std=None):
mean = mean or X.mean()
std = std or X.std()
X = (X - mean) / (std + eps)
_min, _max = X.min(), X.max()
if (_max - _min) > eps:
V = np.clip(X, _min, _max)
V = 255 * (V - _min) / (_max - _min)
V = V.astype(np.uint8)
else:
V = np.zeros_like(X, dtype=np.uint8)
return Vsr, n_mels, fmin, fmax = Config.sampling_rate, 128, Config.fmin, Config.fmax
def audio_to_image(audio):
melspec = compute_melspec(audio, sr=sr, n_mels = n_mels, fmin=fmin, fmax=fmax)
image = mono_to_color(melspec)
return imagepath = Path("../data/")
audio_files = get_files(path / "train_audio", extensions=".ogg")
print(f"Found {len(audio_files)} audio files")Found 24459 audio filesSo we we 24459 audios of different length in the training data
Lets hear some audio and see their spectrogram to get some glimps
# take a random sample
audio_path = random.choice(audio_files)
info = get_audio_info(audio_path)
print(info)
# Convert to spectrogram
audio, sr = sf.read(audio_path)
img = audio_to_image(audio)
# show spectrogra
plt.imshow(img)
plt.show()
# play audio
y, sr = lb.load(audio_path)
Audio(y, rate=sr){'frames': 2066390, 'sr': 32000, 'duration': 64.5746875}
# take a random sample
audio_path = random.choice(audio_files)
info = get_audio_info(audio_path)
print(info)
# Convert to spectrogram
audio, sr = sf.read(audio_path)
img = audio_to_image(audio)
# show spectrogra
plt.imshow(img)
plt.show()
# play audio
y, sr = lb.load(audio_path)
Audio(y, rate=sr){'frames': 906971, 'sr': 32000, 'duration': 28.34284375}
# take a random sample
audio_path = random.choice(audio_files)
info = get_audio_info(audio_path)
print(info)
# Convert to spectrogram
audio, sr = sf.read(audio_path)
img = audio_to_image(audio)
# show spectrogra
plt.imshow(img)
plt.show()
# play audio
y, sr = lb.load(audio_path)
Audio(y, rate=sr){'frames': 301760, 'sr': 32000, 'duration': 9.43}
# take a random sample
audio_path = random.choice(audio_files)
info = get_audio_info(audio_path)
print(info)
# Convert to spectrogram
audio, sr = sf.read(audio_path)
img = audio_to_image(audio)
# show spectrogra
plt.imshow(img)
plt.show()
# play audio
y, sr = lb.load(audio_path)
Audio(y, rate=sr){'frames': 1496832, 'sr': 32000, 'duration': 46.776}
# take a random sample
audio_path = random.choice(audio_files)
info = get_audio_info(audio_path)
print(info)
# Convert to spectrogram
audio, sr = sf.read(audio_path)
img = audio_to_image(audio)
# show spectrogra
plt.imshow(img)
plt.show()
# play audio
y, sr = lb.load(audio_path)
Audio(y, rate=sr){'frames': 1823232, 'sr': 32000, 'duration': 56.976}
You will find that the bird sound is brighter on the spectrogram
Since sample rate is 32000, so a 56.976s audio when loaded using python it will become a array of length 56.976 * 32000 = 1823232 which is number of frame.
If you want to dig deepler into how sound is represented digitally - check this blog
Lets study the metadata to get more insights
df = pd.read_csv('../data/train_metadata.csv')
df.shape(24459, 12)df.head()| primary_label | secondary_labels | type | latitude | longitude | scientific_name | common_name | author | license | rating | url | filename | |
|---|---|---|---|---|---|---|---|---|---|---|---|---|
| 0 | asbfly | [] | ['call'] | 39.2297 | 118.1987 | Muscicapa dauurica | Asian Brown Flycatcher | Matt Slaymaker | Creative Commons Attribution-NonCommercial-ShareAlike 3.0 | 5.0 | https://www.xeno-canto.org/134896 | asbfly/XC134896.ogg |
| 1 | asbfly | [] | ['song'] | 51.4030 | 104.6401 | Muscicapa dauurica | Asian Brown Flycatcher | Magnus Hellström | Creative Commons Attribution-NonCommercial-ShareAlike 3.0 | 2.5 | https://www.xeno-canto.org/164848 | asbfly/XC164848.ogg |
| 2 | asbfly | [] | ['song'] | 36.3319 | 127.3555 | Muscicapa dauurica | Asian Brown Flycatcher | Stuart Fisher | Creative Commons Attribution-NonCommercial-ShareAlike 4.0 | 2.5 | https://www.xeno-canto.org/175797 | asbfly/XC175797.ogg |
| 3 | asbfly | [] | ['call'] | 21.1697 | 70.6005 | Muscicapa dauurica | Asian Brown Flycatcher | vir joshi | Creative Commons Attribution-NonCommercial-ShareAlike 4.0 | 4.0 | https://www.xeno-canto.org/207738 | asbfly/XC207738.ogg |
| 4 | asbfly | [] | ['call'] | 15.5442 | 73.7733 | Muscicapa dauurica | Asian Brown Flycatcher | Albert Lastukhin & Sergei Karpeev | Creative Commons Attribution-NonCommercial-ShareAlike 4.0 | 4.0 | https://www.xeno-canto.org/209218 | asbfly/XC209218.ogg |
df.primary_label.nunique()182There are total 182 unique birds sounds in the competitions
value_counts = df['primary_label'].value_counts()Number of sample available for each bird
# Plotting only the top N values
top_n = value_counts.head(50) # Adjust N as needed
top_n.plot(kind='bar', figsize=(20, 6))
plt.title('Top N Value Counts of column_name')
plt.xlabel('Unique Values')
plt.ylabel('Counts')
plt.xticks(rotation=45)
plt.show()
# Plotting only the bottom N values
top_n = value_counts.tail(50) # Adjust N as needed
top_n.plot(kind='bar', figsize=(20, 6))
plt.title('Top N Value Counts of column_name')
plt.xlabel('Unique Values')
plt.ylabel('Counts')
plt.xticks(rotation=45)
plt.show()
For few birds 500 samples are present while for some there are only 5
Destribution of bird on the global map
fig = px.scatter_mapbox(df, lat='latitude', lon='longitude', color='primary_label',
hover_name='primary_label', hover_data=['latitude', 'longitude'],
title='Geographical Distribution of Bird Species',
zoom=1, height=600)
fig.update_layout(mapbox_style="open-street-map")
fig.show()Data contain sound of all over the world, but there are two huge cluster on Asia and Europe.
Lets study about few birds
name = "yebbab1"
temp = df.loc[df['primary_label'] == name]
print(f"total number of bird in the dataset: {len(temp)}")
# Download some images of the bird
fig = px.scatter_mapbox(temp, lat='latitude', lon='longitude', color='primary_label',
hover_name='primary_label', hover_data=['latitude', 'longitude'],
title='Geographical Distribution of Bird Species',
zoom=1, height=600)
fig.update_layout(mapbox_style="open-street-map")
fig.show()
# Assuming 'temp' is a DataFrame with bird data
idx = random.randint(0, len(temp)-1)
entry = temp.iloc[idx]
filename = entry['filename']
scientific_name = entry['scientific_name']
common_name = entry['common_name']
urls = search_images_ddg(common_name, max_images=1)
# Display bird information
display(Markdown(f"### Bird Information"))
display(Markdown(f"**Scientific Name:** {scientific_name}"))
display(Markdown(f"**Common Name:** {common_name}"))
display(Image(url=urls[0], width=300, height=300))
# Audio information
audio_path = os.path.join(Config.audios_path, filename)
info = get_audio_info(audio_path)
display(Markdown(f"### Audio Information"))
print(f"Audio Info: {info} \n")
# Audio Spectrogram
display(Markdown(f"### Audio Spectrogram"))
audio, sr = sf.read(audio_path)
img = audio_to_image(audio)
plt.imshow(img)
plt.axis('off') # Optional: Hide axis
plt.show()
# Play audio
y, sr = lb.load(audio_path)
display(Audio(y, rate=sr))total number of bird in the dataset: 28
Audio Info: {'frames': 354048, 'sr': 32000, 'duration': 11.064}
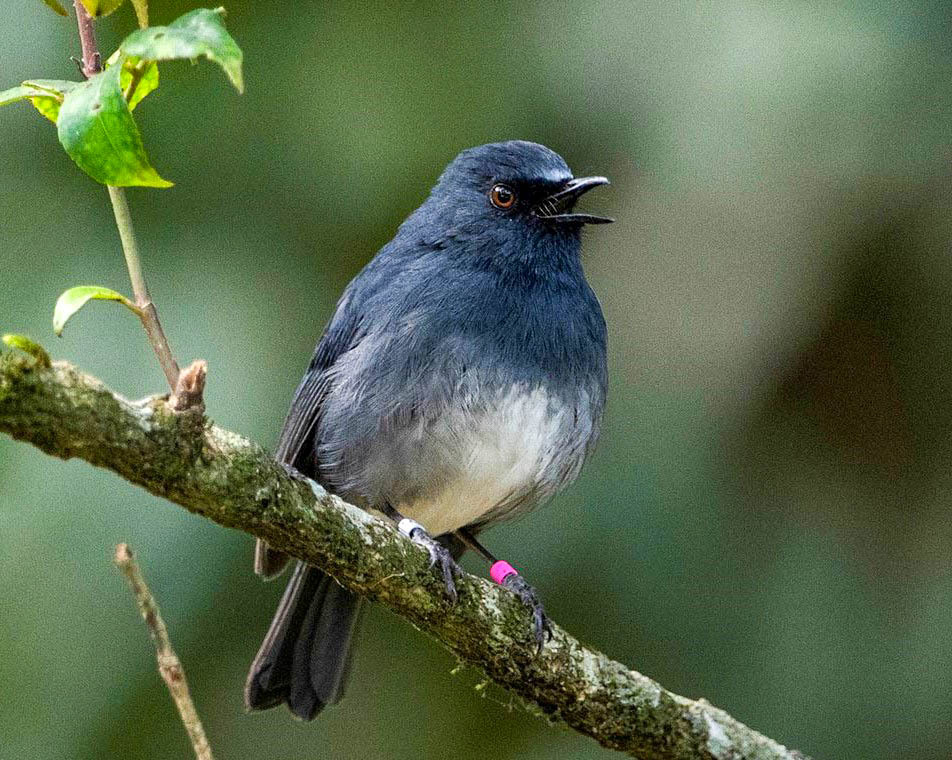
Bird Information
Scientific Name: Argya affinis
Common Name: Yellow-billed Babbler

Audio Information
Audio Spectrogram

Moipig1
name = "moipig1"
temp = df.loc[df['primary_label'] == name]
print(f"total number of bird in the dataset: {len(temp)}")
# Download some images of the bird
fig = px.scatter_mapbox(temp, lat='latitude', lon='longitude', color='primary_label',
hover_name='primary_label', hover_data=['latitude', 'longitude'],
title='Geographical Distribution of Bird Species',
zoom=1, height=600)
fig.update_layout(mapbox_style="open-street-map")
fig.show()
# Assuming 'temp' is a DataFrame with bird data
idx = random.randint(0, len(temp)-1)
entry = temp.iloc[idx]
filename = entry['filename']
scientific_name = entry['scientific_name']
common_name = entry['common_name']
urls = search_images_ddg(common_name, max_images=1)
# Display bird information
display(Markdown(f"### Bird Information"))
display(Markdown(f"**Scientific Name:** {scientific_name}"))
display(Markdown(f"**Common Name:** {common_name}"))
display(Image(url=urls[0], width=300, height=300))
# Audio information
audio_path = os.path.join(Config.audios_path, filename)
info = get_audio_info(audio_path)
display(Markdown(f"### Audio Information"))
print(f"Audio Info: {info} \n")
# Audio Spectrogram
display(Markdown(f"### Audio Spectrogram"))
audio, sr = sf.read(audio_path)
img = audio_to_image(audio)
plt.imshow(img)
plt.axis('off') # Optional: Hide axis
plt.show()
# Play audio
y, sr = lb.load(audio_path)
display(Audio(y, rate=sr))total number of bird in the dataset: 27
Audio Info: {'frames': 589322, 'sr': 32000, 'duration': 18.4163125}
Bird Information
Scientific Name: Ducula badia
Common Name: Mountain Imperial-Pigeon

Audio Information
Audio Spectrogram

name = "integr"
temp = df.loc[df['primary_label'] == name]
print(f"total number of bird in the dataset: {len(temp)}")
# Download some images of the bird
fig = px.scatter_mapbox(temp, lat='latitude', lon='longitude', color='primary_label',
hover_name='primary_label', hover_data=['latitude', 'longitude'],
title='Geographical Distribution of Bird Species',
zoom=1, height=600)
fig.update_layout(mapbox_style="open-street-map")
fig.show()
# Assuming 'temp' is a DataFrame with bird data
idx = random.randint(0, len(temp)-1)
entry = temp.iloc[idx]
filename = entry['filename']
scientific_name = entry['scientific_name']
common_name = entry['common_name']
urls = search_images_ddg(common_name, max_images=1)
# Display bird information
display(Markdown(f"### Bird Information"))
display(Markdown(f"**Scientific Name:** {scientific_name}"))
display(Markdown(f"**Common Name:** {common_name}"))
display(Image(url=urls[0], width=300, height=300))
# Audio information
audio_path = os.path.join(Config.audios_path, filename)
info = get_audio_info(audio_path)
display(Markdown(f"### Audio Information"))
print(f"Audio Info: {info} \n")
# Audio Spectrogram
display(Markdown(f"### Audio Spectrogram"))
audio, sr = sf.read(audio_path)
img = audio_to_image(audio)
plt.imshow(img)
plt.axis('off') # Optional: Hide axis
plt.show()
# Play audio
y, sr = lb.load(audio_path)
display(Audio(y, rate=sr))total number of bird in the dataset: 5
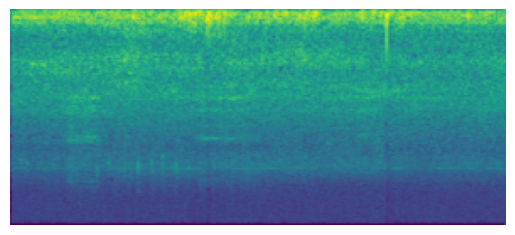
Audio Info: {'frames': 150465, 'sr': 32000, 'duration': 4.70203125}
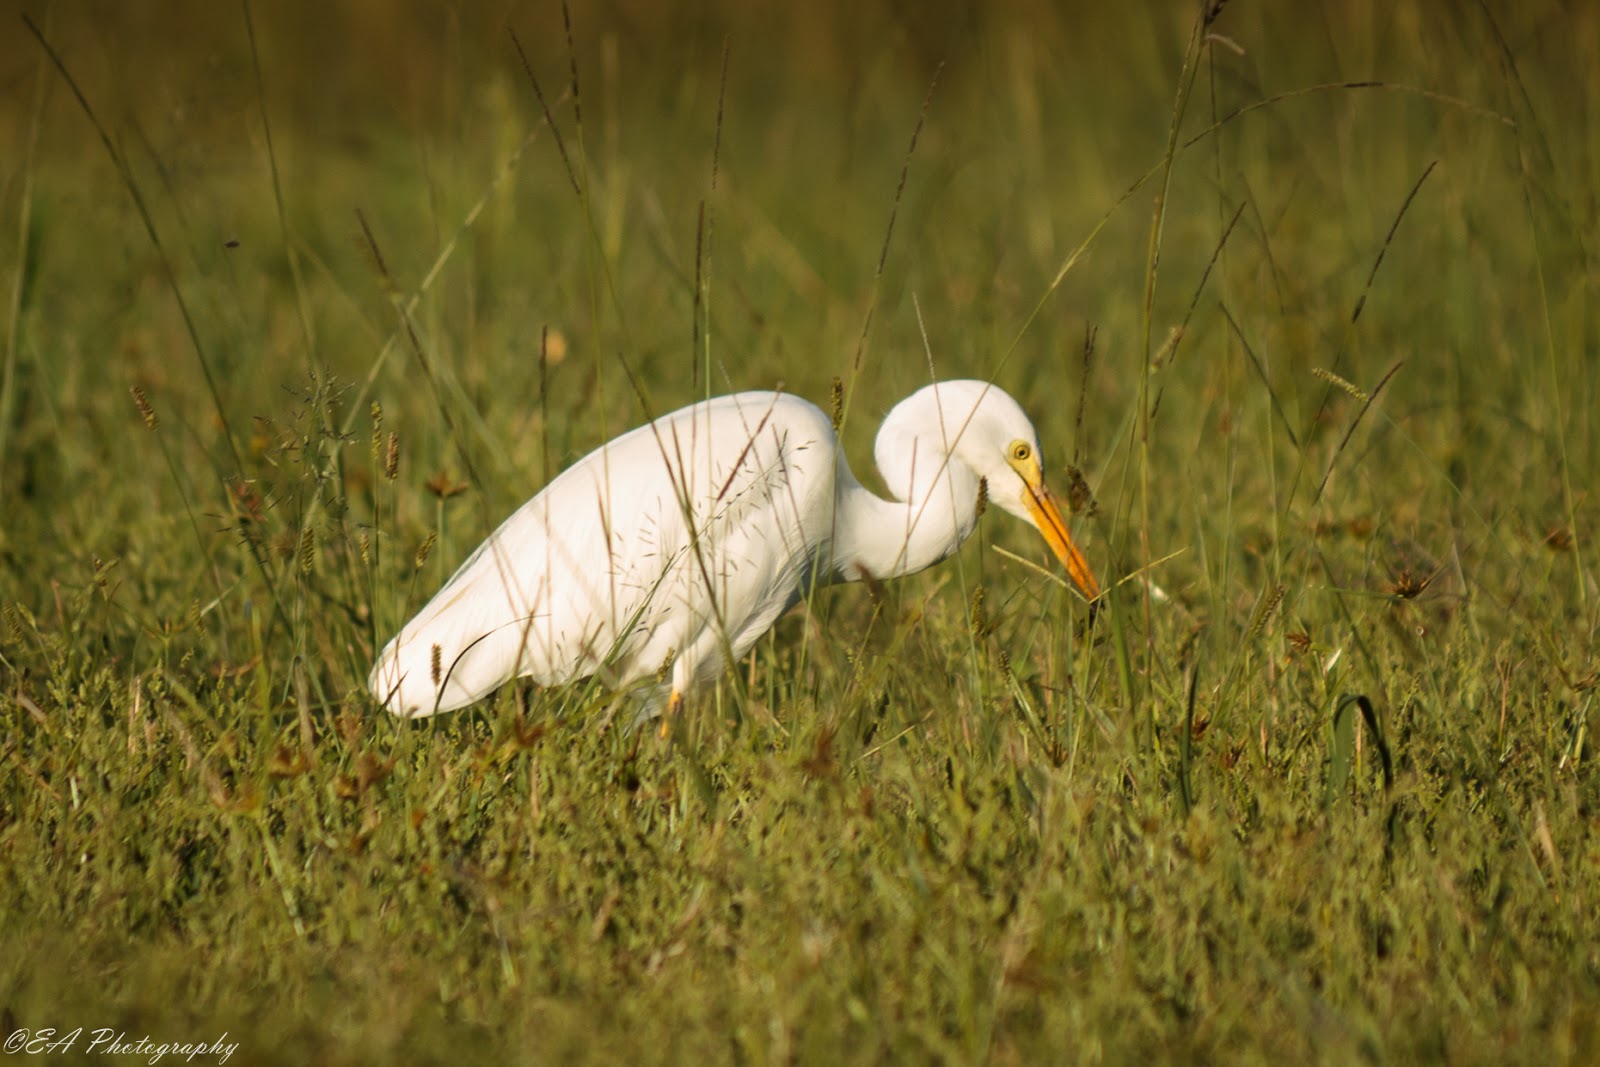
Bird Information
Scientific Name: Ardea intermedia
Common Name: Intermediate Egret

Audio Information
Audio Spectrogram
